Showing posts with label Goverment Spending Growth. Show all posts

Wednesday, December 26, 2012

Total Government Spending And GDP

A post I wrote a while back covered America's GDP and Federal spending.  If federal spending were taken out of the US economy then it would be a rather large drop in productive GDP. The adjusted GDP, taking out federal government spending, the US economy hovered a little over 10 trillion dollars rather than 14 to 15 trillion reported by the government today. At the time I did not include state and local spending in the mix.  Well, after a trip to the website government spending com, I was able to gather more data to add to my previous GDP chart.

Here is the now updated chart that shows what our GDP would be if we subtracted state and local government spending. And as we can see, private sector GDP shrinks down to 7.9 trillion dollars.


To reiterate my earlier point, while it appears that the US has recovered from the 2008 recession with a 2010 GDP of 14.2 trillion dollars compared to a 2008 GDP of 14.3 trillion.  However, when factoring government spending private sector GDP still has yet to match its 2008 levels. Here is a bar chart showing the dollar amount of of GDP that is private sector versus government sector.


In 2008 private sector GDP reached its zenith of 8.5 trillion dollars, down from a high of 8.6 trillion the year before. In 2010 private sector GDP is 610.30 billion dollars less than it was in 2008 even though our GDP is ostensibly larger by 139 billion dollars. Funny how our news correspondents talk about the recovery, yet fail to mention this fact.  Perhaps because it points out the fact that there is no recovery. You can argue all you want that government is needed to pump the economy, but when the share of private sector GDP shrinks relative to GDP as a whole, then it is hard to argue the efficacy of such a policy.  At best it becomes a holding action.

However the growth of government spending has long been the hidden white elephant that the media, economists, and the masses could choose to ignore if they deigned not to look for it. Below is a chart showing the yearly share that of GDP that he private sector, federal, state, and local spending account for.


The chart shows two items. The first is that it shows the growing share that government spending accounts for GDP. Just eyeballing the chart you can see that in 1948 government spending at all levels accounted for only around 20% of GDP. In 2010 it appears to have almost doubled doubled. 


Below is a chart showing the yearly split between private sector and government spending that accounts for GDP since 1940 and the yearly economic growth rates of the economy.


This chart alone doesn't prove definitively that government spending is the cause for our downward trending economic growth rates. Correspondents and economists would have you believe, not without some merit, that our reduced growth rate is due to demographic and global economic changes.  But, in my opinion, to not even consider that our decreasing economic growth rates may be contributed by growing government spending is like a doctor simply attributing growing weight gain, bone loss, and heart troubles to old age and not acknowledge that the patient went from a 150 to 250 pounds.

The second item that you will also notice is that it isn't just government spending that has ballooned, state and local spending have also grown considerably as shown in the chart below.


Since 1950, outside of local spending, all levels of government spending now increased dramatically. I have a guess as to why local government spending was so high in 1950, and that is that most of that local spending is probably spending by the mega cities of Los Angeles, New York, Chicago and a few of the rust belt cities using the postwar boom to fuel their rapid expansion. Whatever the reason, government spending has undoubtedly increased and it begs the question: How can economists insist that the government is not spending enough money to goose the economy when all levels of government have been on a 60 year binge? At what point will they finally acknowledge that America, throughout our government, has a spending addiction?  

The other aspect that hasn't been covered is that not all of the government spending is backed by actual dollars. Some of it is backed by debt, and as the chart shows, since 1960, outside of the technology infused bubble economy of the 1990's and one year in the next decade, government has run at a deficit. 


This deficit results in government debt which has to be paid for at some point, there is no ignoring this simple fact. When we have to pay this debt and how much of a detrimental effect it will have on the economy remains unclear. But the debt will be paid, and it will have a detrimental effect.  I would hope that anyone reading this post will now acknowledge that government spending could very well have a detrimental affect on our economy; but I doubt I have presented enough evidence to convince those who aren't already convinced. What I do think I have done rather convincingly is show that the GDP figures do not reflect the reality of the ground in any way. Americas economy is on the ropes, not recovering.





Monday, December 3, 2012

Raising Taxes Will Not Make a Lick Of Difference


This is a chart I did not make myself, rather I pulled it from an MSN article that was trying to make a case saying that the American tax payer has had it easy for a long time.  The author simply cannot, or just will not, see that we have a spending problem.  Though I will be fair and give the author credit for admitted that Al Gore also promised to cut taxes, however, when both candidates of two different parties are promising to do essentially the same thing, only differing in the matter of degree, is that not indicative of something larger?*

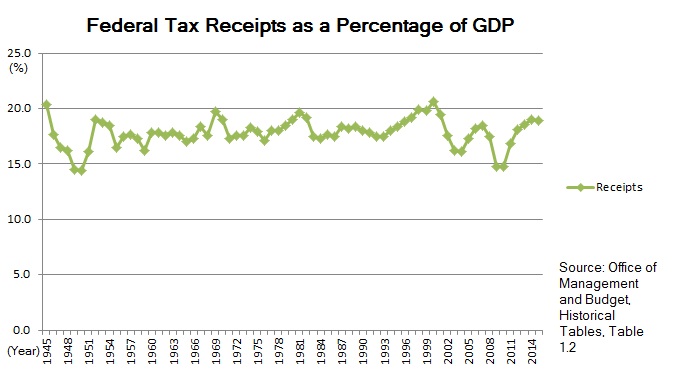
Moreover, the author is missing something entirely. He can believe that the American tax payer has had it easy, receiving more 'benefits' from the government than what they have been willing to pay, but that is ignoring that at one point marginal tax rates on the rich were far higher than they are now. This chart does not go back that far stopping at 1990 because by going back any farther it would disapprove the authors attempted point, that we need to raise taxes in order to goose government revenue.  Here is the chart the author should have posted if he were to be intellectually honest.


As you can see government revenue as a percentage of GDP has stayed very constant, never exceeding 20% of GDP and never going under 15%.  This has been the case for over 60 years regardless of the nominal tax rate.  In 1945 to around Kennedy's tax reforms in 1962 the top marginal tax rate was 91%, far higher than they are now, yet revenue is hardly any different.  In fact, even just eyeballing the chart you will see that revenue dips roughly correspond to economic recession that occurred in the United States.


It should be no wonder then that tax revenue has fallen recently, and it should be equally clear that raising marginal rates will make no difference on how much revenue we receive.  The rich are people like everyone else, save that they have more options available to them, and if they think they are getting fleeced then they will hall up and move.  This has long been a tenant of free market theory, and has been proven empirically, just look at Great Britain.
 
It is then, with this new knowledge and awareness, that we see by looking at the original chart posted by the MSN author, that it clearly shows a spending problem.  Never in our 60 year history has tax revenue ever exceeded 20% of GDP, regardless of marginal tax rates, yet spending has consistently exceeded this mark. . If real world empirical evidence shows this, and it does, then only a wilfully foolish individual would contend the opposite.  But that is how propaganda works, contend that something is right and true whether or not reality reflects this.  The Soviets were able to do so for over 70 years, but in the end Communism was shown to be the broken house that it was. It will not be too much longer until democratic socialism is shown to be just as broken.
 
Finally, this is what angers me most, is that whether or not you believe the rich should pay more of their income in taxes, you should still be tempered by reality, and not the reality of one's own choosing but as it actually exists. And reality here clearly shows that we will not receive more than 20% of our revenue in GDP, we have 60 years of data to back up this statement. Barring any fundamental change towards Americans attitudes towards paying taxes this will not change. So any effort to try and do so is a waste of time and resources that would be better spent elsewhere.  Imagine all the brain, monetary, and legal power that is wasted towards pursuing an end that cannot be achieved, and what would happen, if it instead, all that energy was directed towards more more attainable and productive ends.
 
 
*Lastly, without going into my rant on how the surplus never really existed, the first chart should point out something all too clear. That the surplus was temporary, and that if we were to maintain an actual surplus then spending has to remain below the 50 year trend line.

About Me

My photo
Seattle resident whose real name is Kevin Daniels. This blog covers the following topics, libertarian philosophy, realpolitik, western culture, history and the pursuit of truth from the perspective of a libertarian traditionalist.